Understanding network overhead
by Catalin Dumitru
As web developers, we all obsess over asset size and what we can do to reduce them. Switching minifiers, inlining ATF assets, using CDNs is some of tricks we use to reduce download speeds, but keeping files small is just part of the battle. The other half is network latency and the overhead of actually establishing a connection with your servers. In this blog post we will investigate what happens in the time between when you request a resource and it actually starts downloading.
Cold start
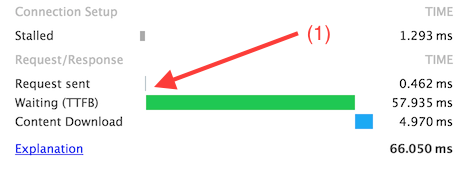
To measure the overhead, let’s see what the nav-timings look like for the Google logo image when performing a cold request.
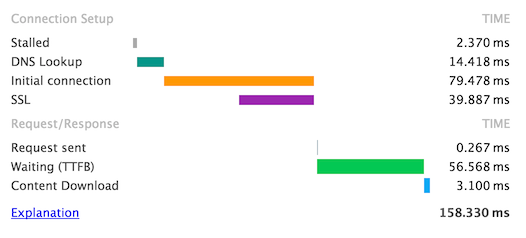
So let’s break down the numbers. DNS takes up 14ms (9%), TCP and SSL negotiation 79ms (50%) and server-time + a network round trip another 56ms (35%). And as for the downloading of the actual content? 3ms or 2% of the total request time. That’s right, all that image compression techniques amount to just 2% of the time it takes to actually download an image, from request start to all bytes received.
The other 98% is just network overhead, so it’s understandable that modern browsers use various optimisation techniques to shorten network latency, and we’ll look at some of them in this blog post.
I’ll be using Chrome’s Developer Tools for network analysis, including the chrome://net-internals diagnosing page.
DNS Resolution
As most of you might be familiar, DNS is the process of converting a dns name (in our case www.googe.ro) to an ip address.
So let’s take a look at what events Chrome emits when performing a DNS resolution.
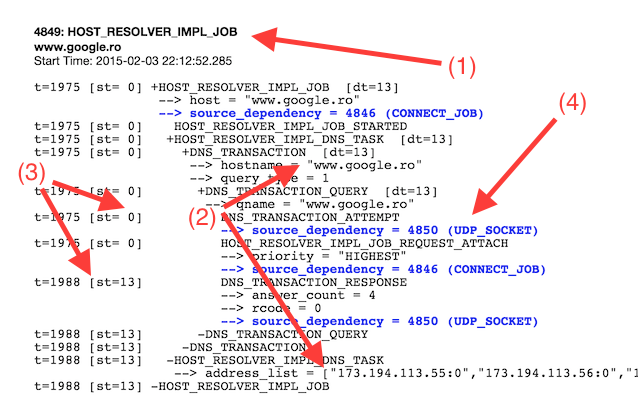
The Chrome event is called HOST_RESOLVER_IMPL_JOB (1) and can be found by searching under the chrome://net-internals/#events tab. We performed a request to resolve www.google.ro and got 4 ips back which match the given DNS name (2). So far so good.
The intersting bit comes when we observe that the time delta for the DNS resolution process is 14ms (3) and that the process involved spawning a socket and connecting through UDP (4) to the nameserver. The delta is the time it takes to get a response from the nameserver through the socket we just opened.
Being such a popular domain, it was most likely cached by my local nameserver (my router) and the resolution time took only 14ms (just a single round-trip from my local browser to the name-server). This would be multiplied by each hop the resolution process makes from name-server to name-server, until we find a match for our DNS name.
It’s only normal that Chrome would take some optimisation steps to reduce DNS resolution times, and one of them is DNS caching. You can check the current state of the cache by going to chrome://net-internals/#dns. In my case, after the initial request, I saw something like this:
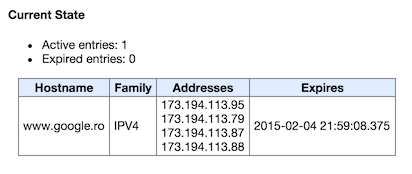
Chrome can keep up to 1000 resolved DNS names into it’s internal cache, which gets adjusted over time using the internal Predictor. The browser performs pre-resolution on DNS hostnames when you type a query in the omnibox or when you hover over a link, and stores the result into it’s internal cache. Considering these heuristics, the DNS name is mostly already resolved by the time you actually click a link.
But thankfully, there is a way to give hints to a browser that a particular DNS name will be needed in the near future, which will trigger a pre-resolve and reduce network latency. The hint is given though a link tag and looks like this:
<link rel="dns-prefetch" href="//dns-name">It’s important to note that this is just a hint and does not guaranty that the browser will actually resolve the given DNS name.
You can also measure the dns resolution time using navigation timing, if you need some actual Real User Metrics:
performance.timing.domainLookupEnd - performance.timing.domainLookupStart;
// = 14
The domain cache also ties in with Domain Sharding, which is the process of using multiple domains to load resources to bypass the 6 concurrent connections per domain Chrome imposes. Although it does help with this limit, you will also incur a DNS resolution penalty for each unique domain the browser has to resolve. But this is a topic for a future blog post, so we won’t go into details.
TCP/SSL connection
The bigest chunk of the network latency we saw when requesting our image was from the TCP and SSL negotiation. So let’s step back and see what this process actually involves.
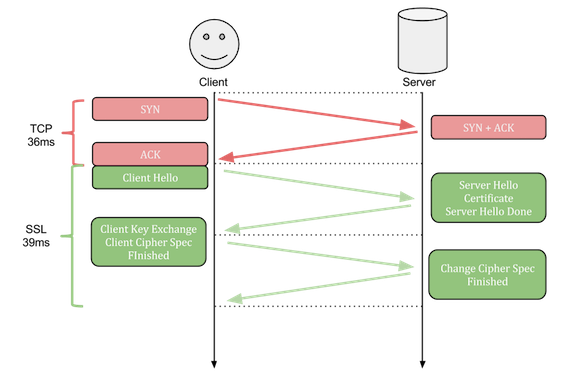
If your using regular HTTP requests (which you shouldn’t) then the TCP connection protocol involves just a single roundtrip (SYN -> SYN + ACK -> ACK). But things get a little more complicated when adding SSL/TLS over regular TCP connections.
Because SSL uses TCP as a transport protocol, to establish a connection, the same steps must be followed as with a regular TCP connection (SYN -> SYN + ACK -> ACK), with an added difference where the last ACK packet sent to the server contains additional data needed to start SSL negotiation (Client Hello). From here, SSL will require 2 additional roundtrips to finish the protocol.
In our case, we do use HTTPS and SSL to request the sample image, so we incur a latency hit from 3 additional roundtrips, which in our case lasts a total of 79ms (including socket overhead). So let’s see how the event for the TCP/SSL negotiation looks like, by once again visiting the chrome://net-internals/#events page:
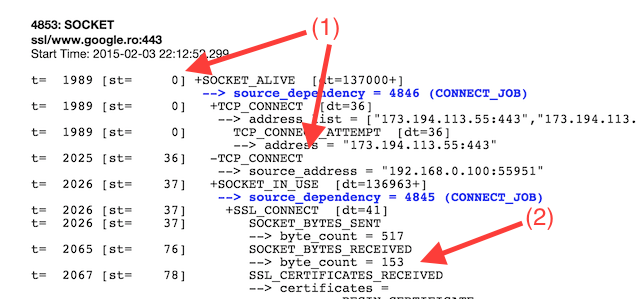
We see from the event details that the first round-trip took 36ms (1), and this was just for the first TCP negotiation, before the SSL protocol starts. At time 36ms the “Client Hello” message is also sent, which ends in a response from the server at time 76ms (2). So far so good. This ends the second round-trip out of a total of three.
But let’s look lower in the event description:
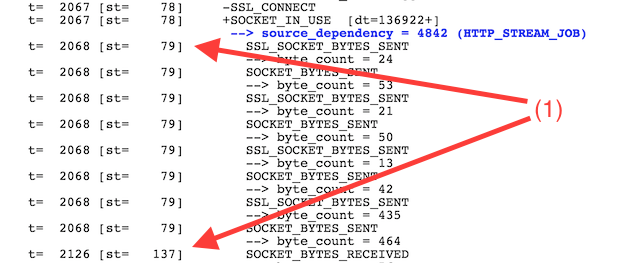
The application data (image content) started receiving when the third and final round-trip should have finished, at 137ms (1). This is because Chrome performs an additional optimisation trick over SSL; it sends the encoded application data request with the “Client Cipher Spec” packet, eliminating the need for an additional roundtrip. This is why Chrome only needs two round-trips to establish an HTTPS connection and start requesting the actual resource data.
But two full round-trips for each and every resource is a lot. For a website with 50 unique resources, TCP/SSL negotiation will delay the page from loading by 4 full seconds. That’s a lot of network overhead.
To eliminate some of this overhead, some alternatives to HTTPS have been created, including SPDY and HTTP/2. Both of these work over the current SSL implementation, but add multiplexing over a single connection. This means that you can stream multiple resources on the same TCP/SSL connection, reducing the overhead of creating a new connection for each requested resource.
But SPDY and HTTP/2 adoption is not quite there yet, so Chrome uses some additional optimisation techniques to further reduce connection times.
Besides DNS names, Chrome also keeps a cache of active TCP connections. You can view the current state of the browser cache by visiting chrome://net-internals/#sockets
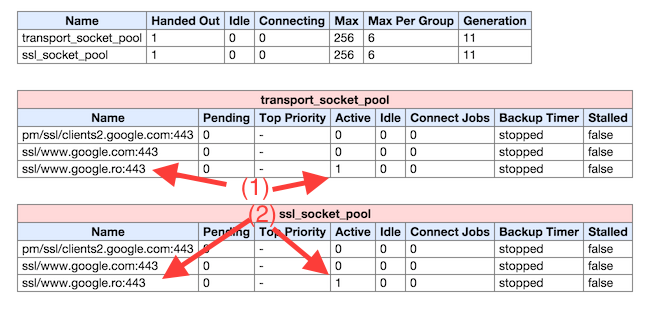
In my case, after requesting the Google logo, I have one (duplicated) active socket connection (ssl/www.google.ro). Chrome imposes a maximum number of active TCP/SSL connections which can be cached per domain, with the current limit being 6 (and global maximum of 256). This means, that if your page has many resource which should be requested from the same domain, you’ll only get 6 concurrent downloads. The rest will be queued until an open slot is made.
But this limit also means that you’ll incur a maximum of 6 TCP/SSL connection time penalties for the very first resources you request. The rest will re-use existing connections and bypass the initial overhead of establishing a link.
In addition, these socket caches can be reused even when navigating to the same domain, either in the current tab or in a separate one. This is because Chrome has a monolithic network stack. Tabs might get split into multiple processes, but the one which actually requests resources from the network will always be shared between all running tabs.
To see this in action, let’s see what happens to the network timings when opening the same image in a new tab:
Because the TCP/SSL connection is already cached from the previous tab, the browser can simply bypass the initial negotiation phase and perform a resource request from the start. Network timings reflect this, with 0 DNS resolution time and 0 initial connection time.
And similar to DNS timings, you can get TCP/SSL timings for RUM by using the Navigation Timing API:
// TCP negotiations timing
performance.timing.secureConnectionStart - performance.timing.connectStart
// = 43

// SSL negotiations timing
performance.timing.connectEnd - performance.timing.secureConnectionStart
// = 53
And also similar to DNS, you can give hints to a browser that it should establish a connection to a particular origin before it is actually needed. This is useful when you expect to request a resource from a new domain and you don’t want to incur the TCP/SSL negotiation penalty. But most modern browsers have very good predictors implemented, which does the pre-fetching and pre-connecting for you. So in most situations, it’s best if you use the default behaviour of the browser.
<link rel="preconnect" href="//<domain>">Further Reading
- https://www.igvita.com/posa/high-performance-networking-in-google-chrome/
- https://www.igvita.com/2012/06/04/chrome-networking-dns-prefetch-and-tcp-preconnect/
- http://www.inetdaemon.com/tutorials/internet/tcp/3-way_handshake.shtml
- https://www.ietf.org/proceedings/32/sec/cat.elgamal.slides.html
- http://chimera.labs.oreilly.com/books/1230000000545/ch04.html#TLS_HANDSHAKE
- https://www.igvita.com/2013/12/16/optimizing-nginx-tls-time-to-first-byte/